Ticket sales pacing before event day needs a different reading for a recurring Friday club night and a one-off concert. The purchase decisions can happen on different schedules. This comparison explains how to assess both at 30 days, 14 days, and two days out, then choose a response when sales fall behind.
There is no universal percentage that establishes whether either event is healthy. A useful average requires comparable sales histories. The percentages below are explicitly hypothetical planning examples. Use them to understand the differences between sales curves, then replace them with targets drawn from your own dates.
Match the timeline to the buying decision
The most useful comparison starts with what makes someone commit: a familiar night out, a particular artist, or a trip that needs planning.
Recurring club nights
A weekly club night gives customers another opportunity to attend soon. Local guests may also have fewer travel arrangements to settle before buying. That creates a plausible basis for a sales curve concentrated near the event.
It does not establish how late your audience actually buys. Compare the same weekday, event concept, and promotional schedule before treating low advance sales as normal.
Keep recurring event schedules in a separate comparison group from special appearances. Record paid door admissions separately so you can see how much each night depends on walk-up business.
One-off headline club shows
A club booking a specific touring artist has a different purchase proposition from its resident night. Fans may commit when tickets launch because the date or lineup matters to them.
This makes headline club shows a useful middle category. Their audience may include regular customers alongside people buying primarily for the artist.
Compare these shows with other artist-led dates. Record lineup announcement dates and ticket release dates so an apparent sales jump has an identifiable cause.
Concerts and destination events
A concert can attract early purchases around its announcement, followed by quieter periods between promotional pushes. Travel, accommodation, group coordination, and higher purchase commitments can give buyers reasons to decide earlier.
The actual pattern still depends on the act and audience. A concert with mainly local buyers may behave differently from a destination festival.
For concert and event venues, separate single performances from multi-day events. Keep passes and single-day admissions in distinct reporting groups.
Use 30, 14, and two days as checkpoints
These checkpoints give club and concert teams common review dates, while allowing each event to have a different expected curve.
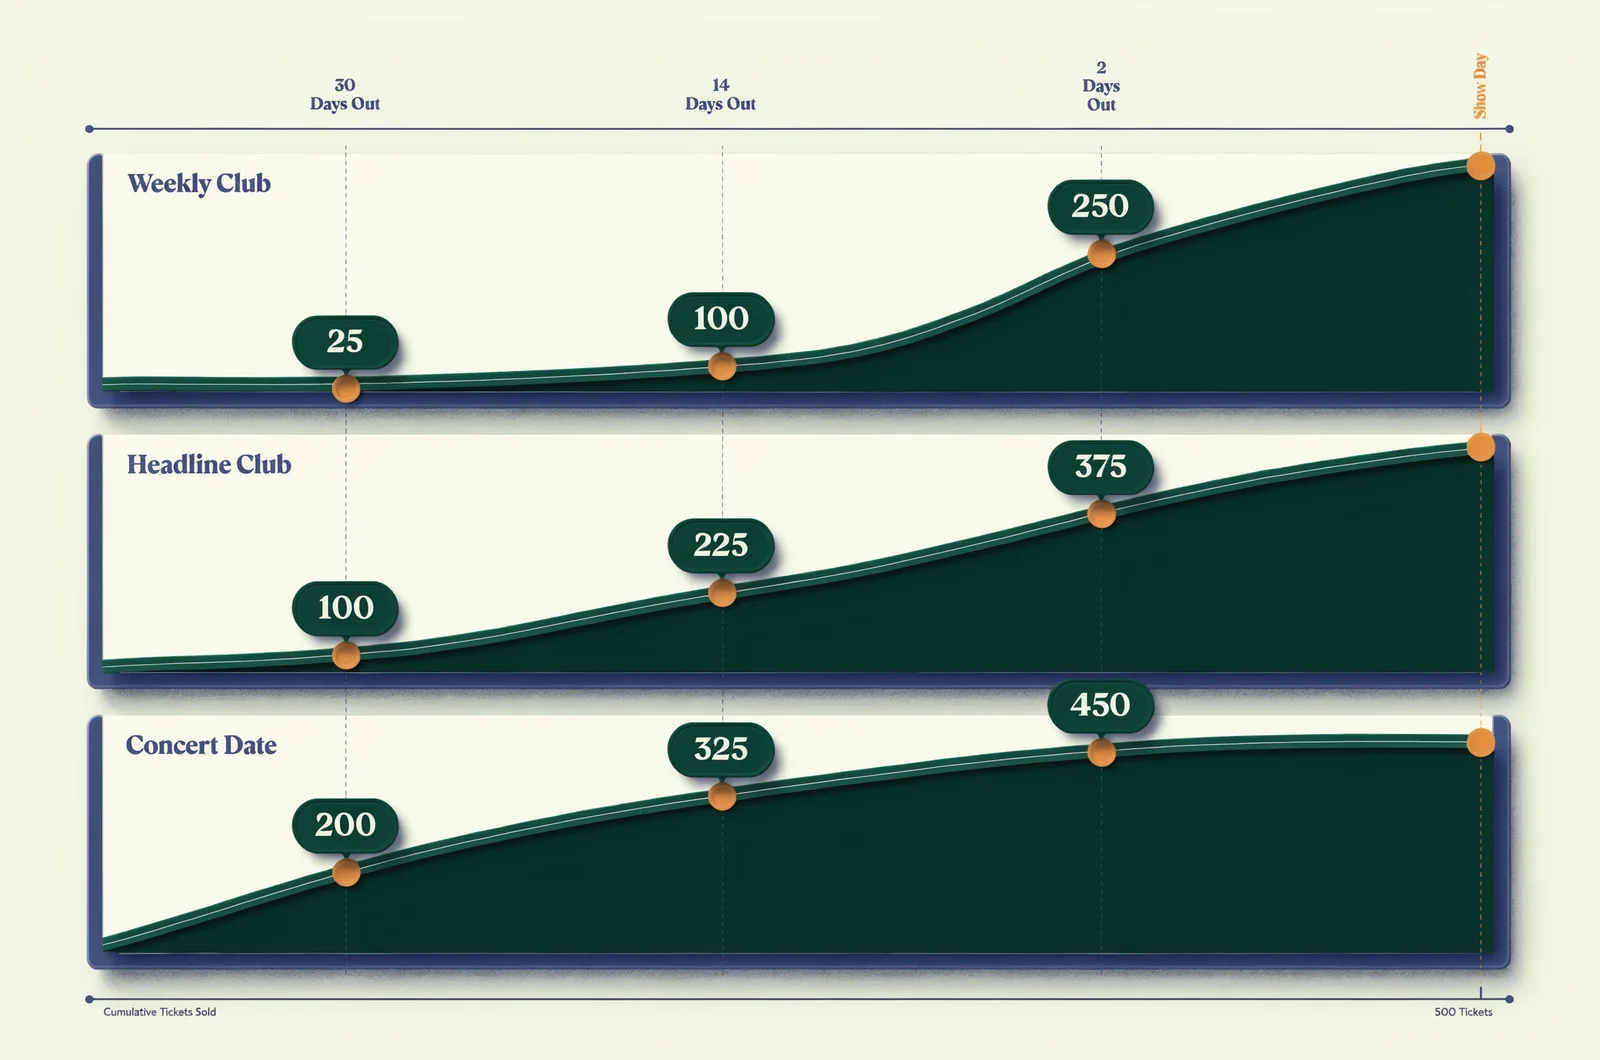
An illustrative plan for 500 paid tickets
Suppose three events each have a goal of selling 500 paid tickets by the close of their sales window. All three launch before the 30-day checkpoint.
The following figures are invented targets for this example. They are neither measured averages nor recommended industry benchmarks.
| Event pattern | 30 days before | 14 days before | Two days before |
|---|---|---|---|
| Recurring club night with late demand | 5%: 25 tickets | 20%: 100 tickets | 50%: 250 tickets |
| One-off headline club show | 20%: 100 tickets | 45%: 225 tickets | 75%: 375 tickets |
| Concert with strong early demand | 40%: 200 tickets | 65%: 325 tickets | 90%: 450 tickets |
Each percentage uses the same denominator: the 500-ticket sales goal. That goal must fit within the event’s available inventory after other allocations.
At two days out, the club plan still requires 250 sales. The concert plan requires 50. Those are very different demands on the remaining selling window.
What each checkpoint should change
At 30 days, check whether the event has reached its intended audience and whether the launch produced the expected response.
At 14 days, compare recent pickup with the next scheduled campaign, announcement, or ticket release. Identify the specific activity expected to close any gap.
At two days, turn the remaining requirement into a daily sales rate and an arrival plan.
If a recurring night has not launched at 30 days, mark that checkpoint “not on sale.” Start its comparison from launch and retain the event-relative checkpoints that apply.
Build a baseline from comparable dates
Your own completed events can turn the club-versus-concert distinction into a working sales plan.
Choose events with similar conditions
Group dates by event format, weekday, audience, price range, and time on sale. Include the same artist where possible, while recording changes in room size or ticket allocation.
A holiday club night deserves a separate comparison from an ordinary weekly date. A concert announced months ahead needs a different reference group from a late booking.
Include weaker completed events as well as sellouts. Otherwise, the baseline hides the outcomes your team needs to recognize.
Record how many events support each comparison. A small or inconsistent group calls for a wider planning range.
Measure the same thing at every checkpoint
Use an event ticket sales report to capture net paid tickets at a consistent cutoff. Subtract refunded or canceled tickets according to one documented rule.
For each completed event, divide checkpoint sales by final net paid sales. That produces the share sold by that point. The median share across comparable dates gives you a starting curve.
Apply that share to the new event’s goal to create a provisional target. Keep the historical spread visible so the median does not look more certain than the underlying dates justify.
Record both days until the event and days since launch. Those two clocks help explain whether slow pickup reflects weak demand or simply less selling time.
Check the ticket gap against cash and capacity
A pace comparison becomes useful when it shows what remains to be sold, collected, and accommodated.
Calculate the remaining sales requirement
Return to the hypothetical recurring club night. Its two-day target is 250 tickets, but actual net sales are 210. It is 40 tickets behind plan.
The full goal remains 500 tickets, so 290 still need to sell. Assuming exactly two selling days remain, the required rate is 145 tickets per day.
If the previous two days produced 80 net sales, the recent rate was 40 per day. The team now has a concrete question: what evidence supports an increase from 40 to 145?
A planned campaign, comparable late buying history, or confirmed group purchase may inform that judgment. Record the assumption beside the forecast.
Keep revenue and attendance measures separate
Ticket count alone cannot tell you whether revenue is on plan. Sales may be concentrated in lower-priced tiers, or refunds may affect cash differently from ticket volume.
Track net paid tickets, net ticket revenue, and average ticket revenue together.
Keep table deposits in a separate revenue line. Count associated admissions according to the booking terms, and prevent guests with both table access and individual tickets from appearing twice.
Maintain complimentary admissions and inventory holds separately from paid sales. Before releasing more tickets, reconcile those allocations against the event’s available capacity.
Choose a response for the event you are selling
A slow club night and a slow concert need different responses because the source of the shortfall may differ.
Recurring nights need a relevant late-demand signal
For a recurring club night, compare the current week with the same selling days in its reference group. Check whether the usual customer messages and promoter activity happened on schedule.
Then examine the purchase path. Weak ticket-page traffic points toward an audience reach problem. Visits without purchases warrant a closer look at price, event information, checkout, and competing plans.
Avoid making a discount the automatic response to low early volume. If the normal buying window has barely started, a discount could reduce revenue from guests who were already likely to attend.
Set the next review for a named time, with a ticket target and a person responsible for the planned activity.
Artist-led dates need launch context
For a concert or headline club show, separate launch sales from subsequent pickup. A strong opening can make the next period look weak even when it follows a familiar pattern.
Compare equivalent periods after launch. Check whether the next artist announcement, partner message, or scheduled release has happened.
If sales are behind, identify which audience the next action can reach. An artist’s local followers, previous attendees, and an existing venue audience are distinct groups.
Write the expected sales contribution beside each proposed action. Revisit that estimate after the activity runs.
Ticket releases need a clear purpose
Keep ticket types and tiers distinct enough to explain what is selling and why.
A planned price increase can create a visible buying deadline. Use it where it fits the event’s pricing plan, with a genuine date or allocation.
Check inventory before changing availability. An event can appear to have weak demand when the tickets buyers want are unavailable, while unused holds remain elsewhere.
For concerts with several ticket categories, inspect each category before applying an event-wide promotion. Record both the units sold and revenue effect after any change.
Make the final 48 hours an operating plan
Two days before a club night or concert, the sales forecast should inform the door, floor, and remaining inventory decisions.
Translate sales into expected arrivals
Separate tickets sold from expected attendance. Use comparable check-in records to build an arrival estimate, and keep uncertain walk-up demand visible as an assumption.
Prepare a lower-attendance scenario and a busier scenario for decisions that remain adjustable. Put the arrival window beside the total: the same attendance can create different door workloads depending on when guests arrive.
If you use VenueStack for ticketed event management, reconcile tickets, table bookings, guest lists, and check-in records before assigning last-minute inventory.
Give the door team the current allocations, admission rules, and remaining sellable inventory at a stated cutoff.
Keep the pace calculation visible
A small pace calculator would help this review. Enter the sales goal, current net sales, expected checkpoint sales, recent daily pickup, and selling days remaining.
It should return the gap to plan, remaining tickets, and required daily rate. Any projection should display its assumed rate.
Assign one person to refresh those inputs after the final campaign and again before the operational handover.
Questions for your next sales meeting
The club-versus-concert comparison becomes easier to use when everyone agrees on what the figures mean.
What percentage should be sold two weeks out?
Use the share sold at that point across comparable completed events, then apply it to the current goal. Keep the historical range beside the central estimate.
The illustrative 20% club target and 65% concert target above belong only to the fictional example. They cannot establish whether another event is healthy.
Where history is thin, label the target as a planning assumption and review it after each completed date.
Should guest list names count toward the sales target?
Count paid tickets toward the paid sales target. Track guest list names as a separate attendance commitment, with their admission conditions recorded.
A name on a list, an unpaid reservation, and a completed purchase carry different levels of certainty. Preserve those distinctions in the report.
For group or table bookings, document how many admissions the purchase includes and how those guests will be checked in.
Does a strong launch mean the event will sell out?
A strong launch establishes early demand. The remaining inventory still needs buyers.
Check the daily rate after launch against comparable events and the sales requirement for the remaining window. Keep refund activity visible.
For an event with several price tiers, also check how much of the early response depended on the first allocation.
When should the team revise the forecast?
Review it at the agreed checkpoints and after material changes, such as a lineup announcement, campaign, ticket release, or inventory adjustment.
Keep the original target beside the revised forecast. Record what changed, the evidence behind the revision, and the date.
After the event, compare both forecasts with final net sales and check-ins. Save the checkpoint snapshots so the next similar date starts with a stronger reference.