Ticket sales analytics: See what last Saturday sold, and what sold it
Reports follow every event from the first ticket to the last arrival: sales pace, ticket types, table sections, pass use and the door count. See which links and promo codes brought buyers in, when your guests buy, and how two nights compare.
From the first sale to the morning after.
An event dashboard for each night, in the order the night runs.
Watch it sell
Each event fills on the timeline as it sells. Open it for its sales pace, each ticket type and how its tables are booking.
Read the guideFollow the night
Today’s Event in Pulse shows tickets scanned against tickets sold, tables arrived and seated, and each door phone, as it happens.
Read the guideRead the morning after
Owners get a recap of last night from 10 AM, with the door count, tickets, tables and sales. The door report adds arrivals by the hour and the male and female split.
Read the guideCompare and plan
Tick two events to see them side by side, with the difference for each figure, and use When people buy to time the next announcement.
Read the guide
In the product.
Event analytics as your team and your guests see it.
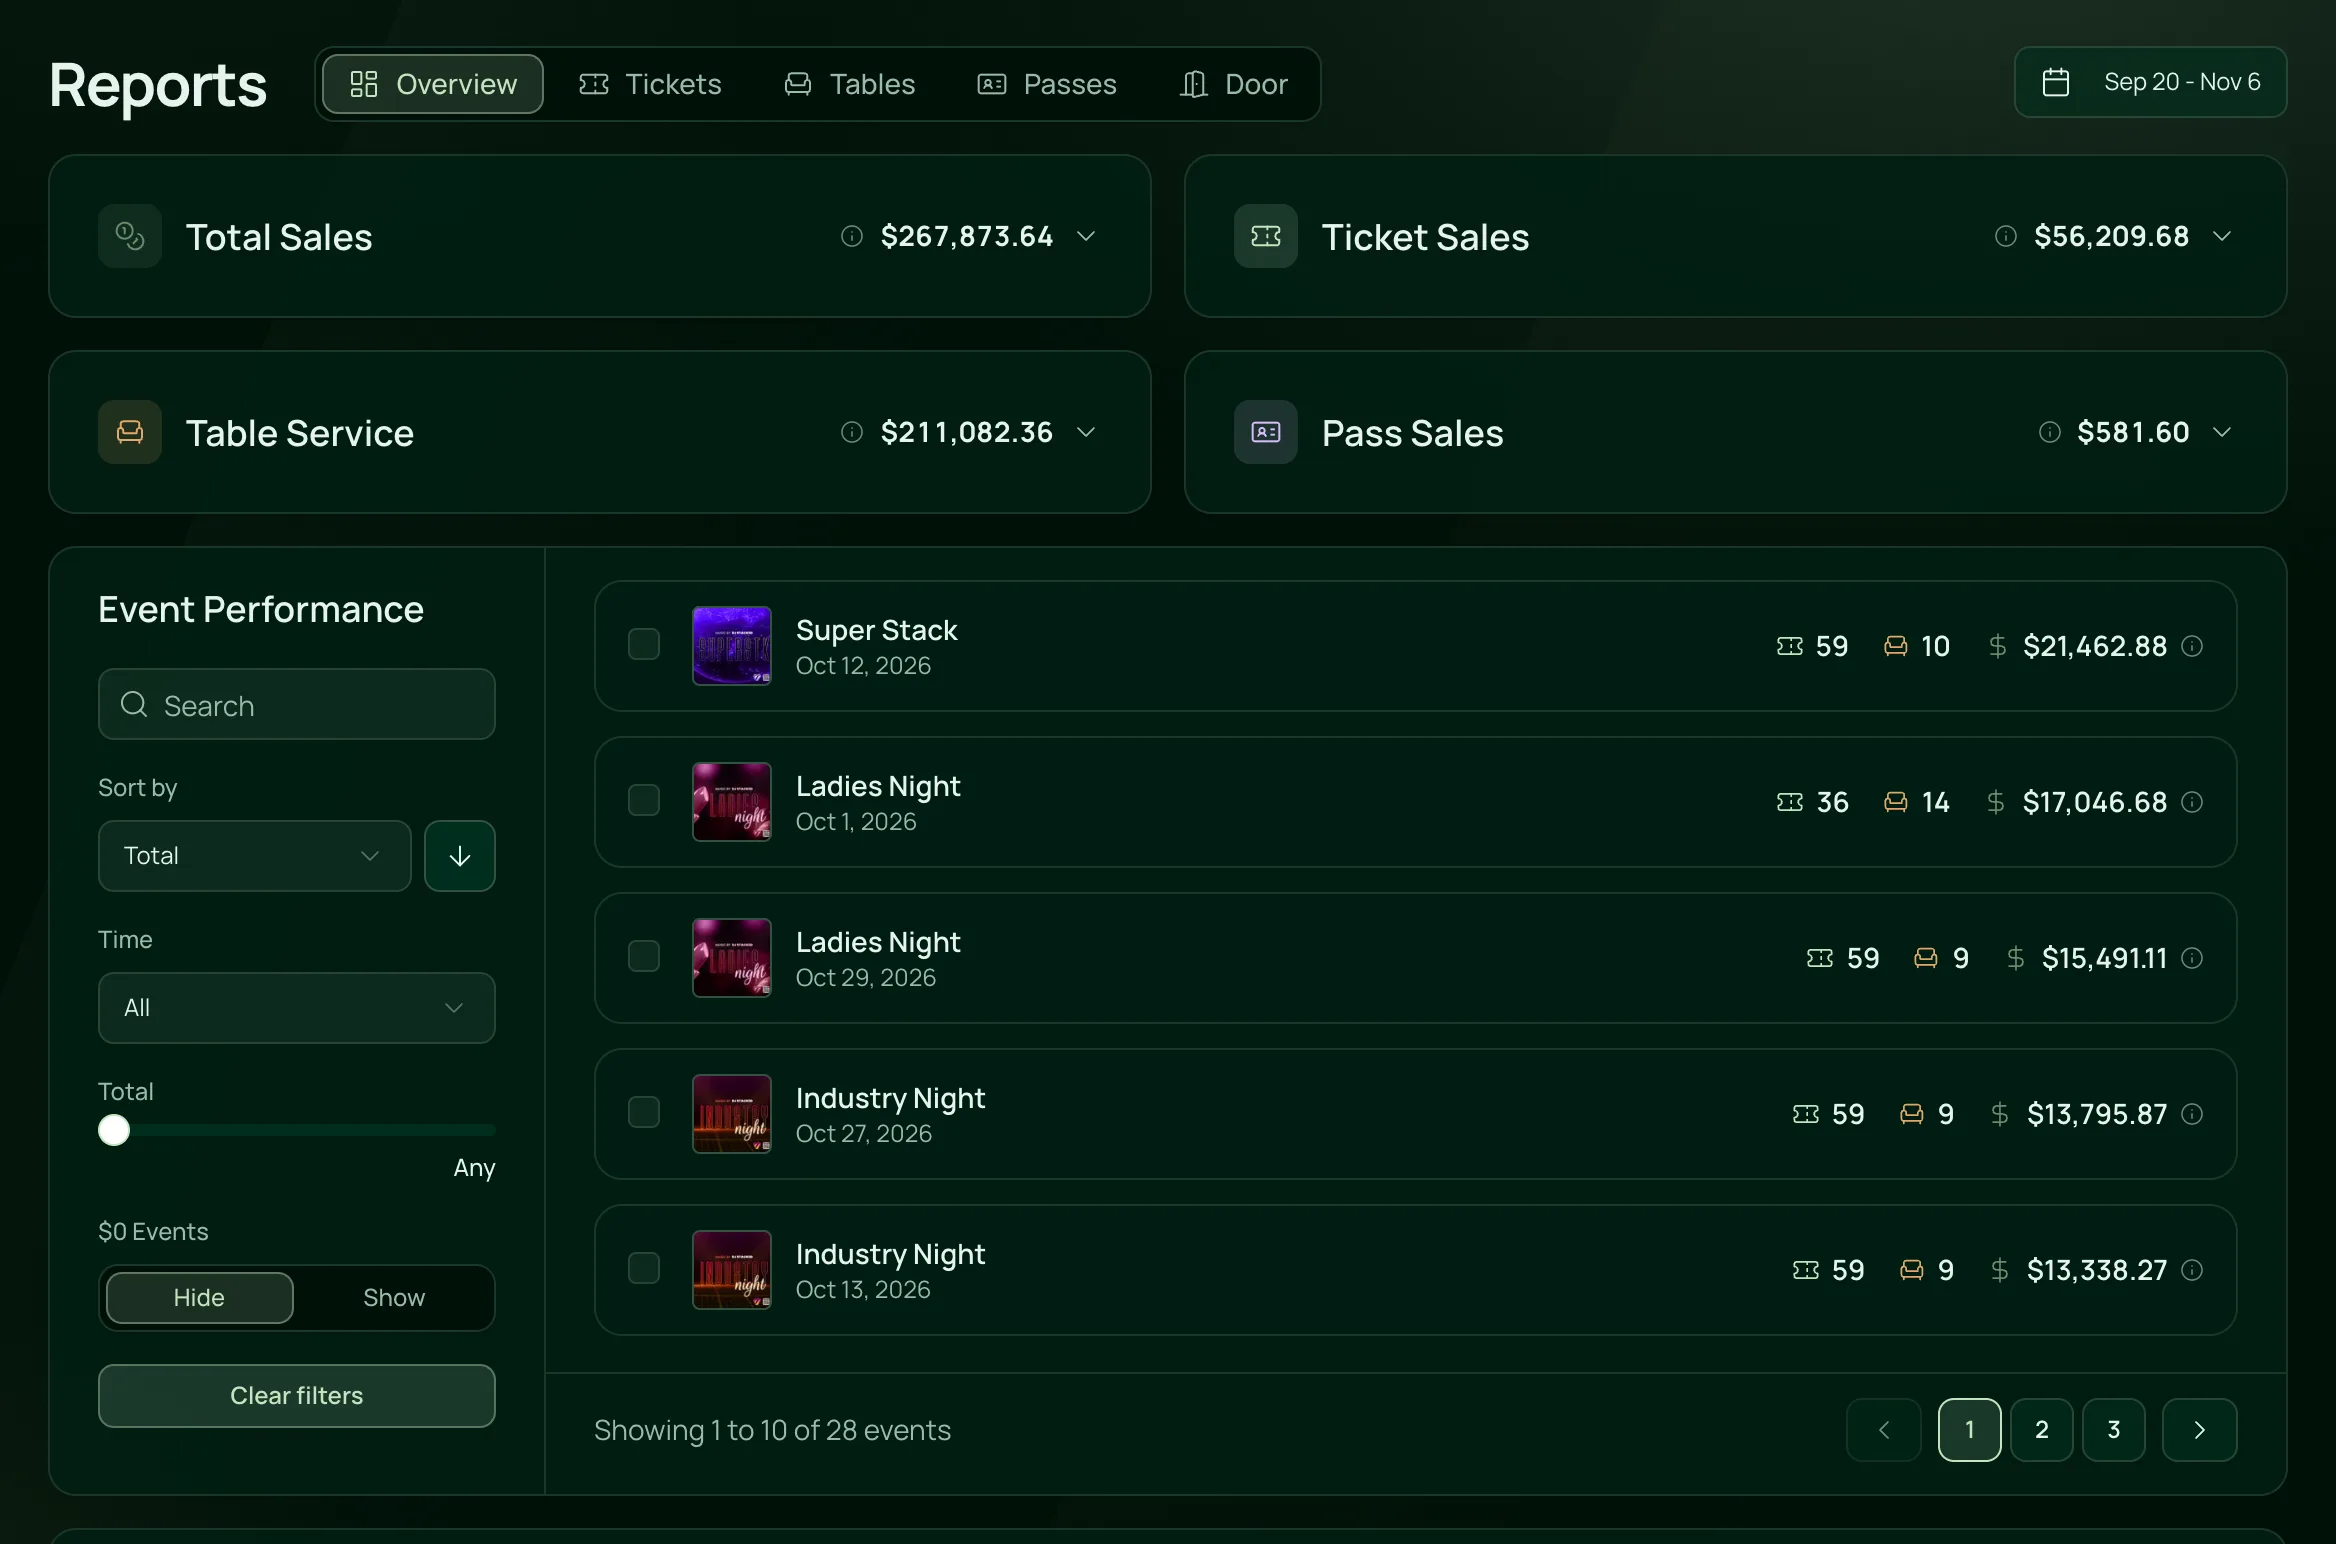
Every night’s takings at a glance
Total sales split into tickets, table service and passes, then each event’s tickets, tables and takings, biggest first.
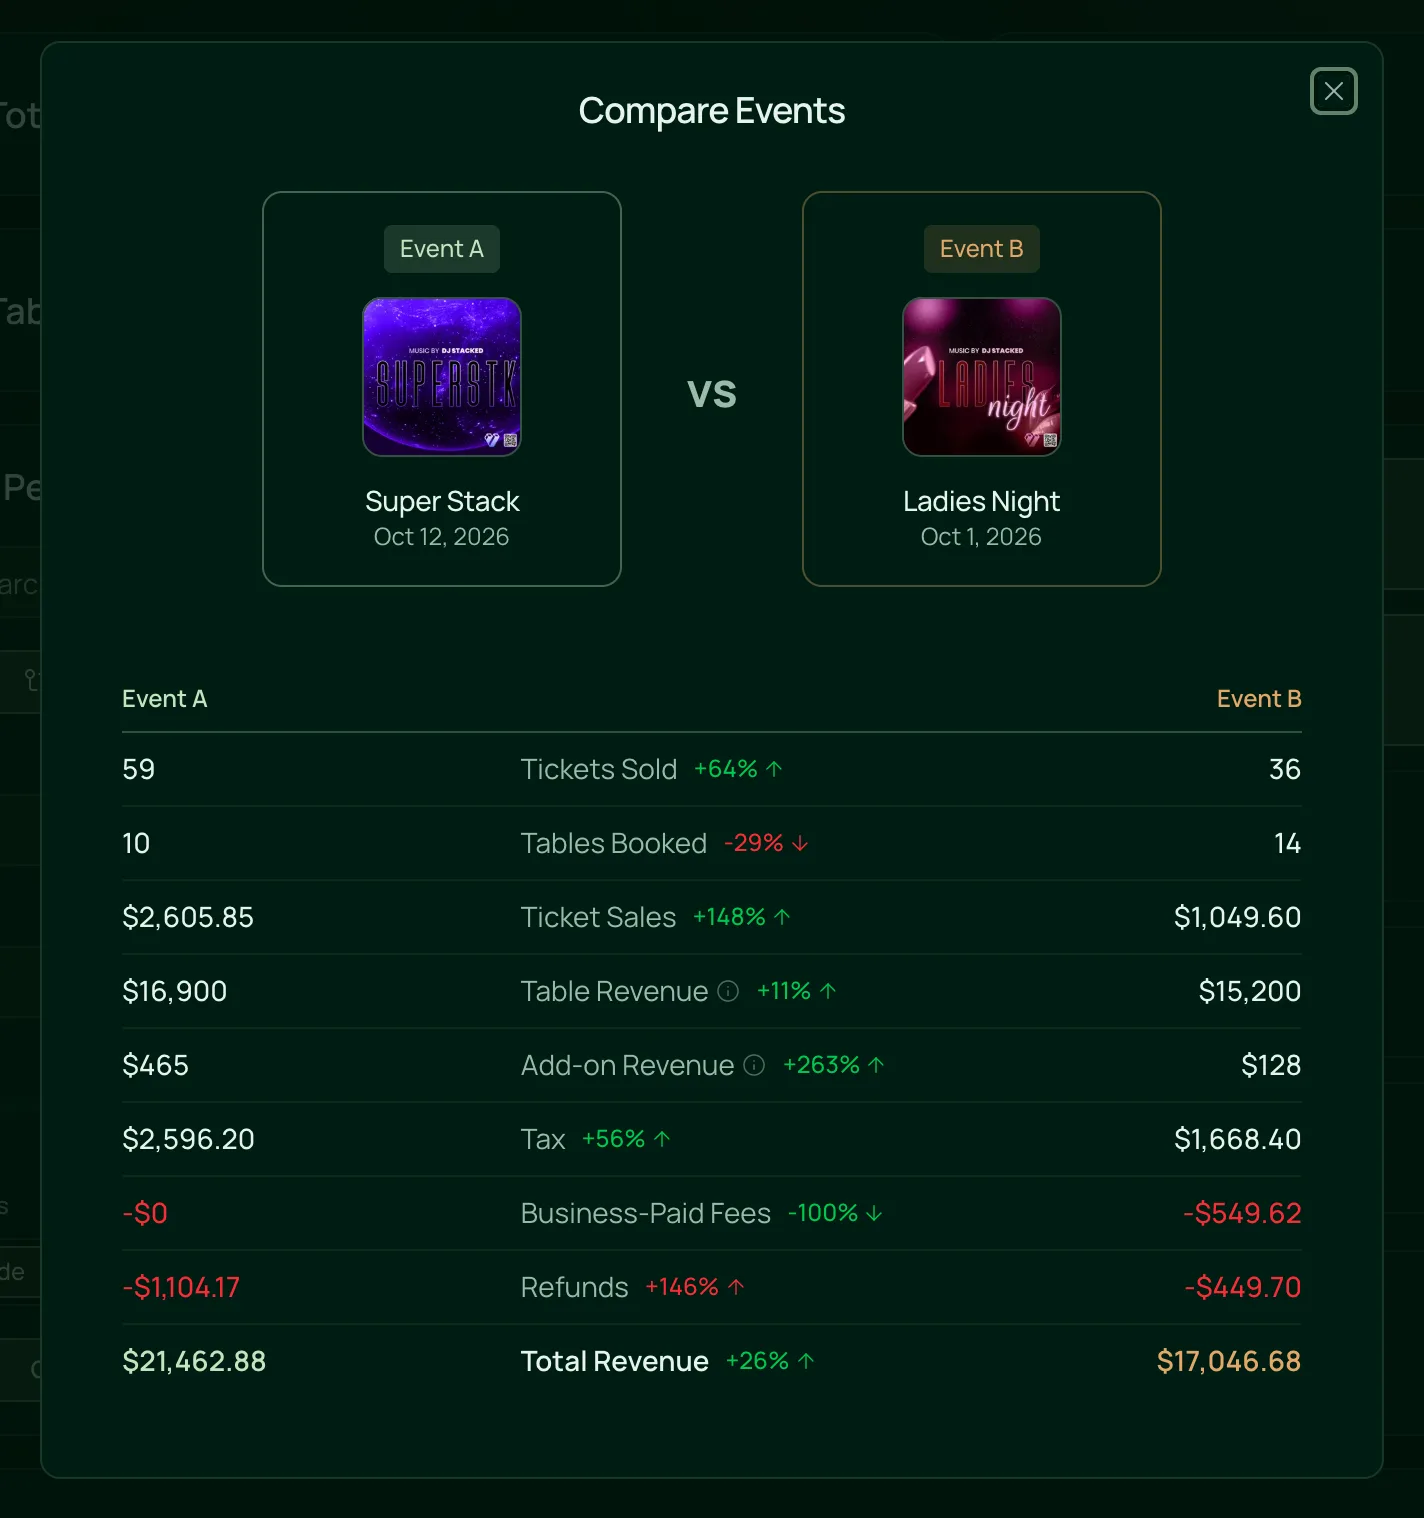
Two nights, side by side
Tickets sold, tables booked, ticket and table revenue, add-ons and tax for any two events, with the change between them.
Everything in the reports.
Event reporting for tickets, tables, passes and the door, on the one plan.
Sales
Sales
Tickets, tables and passes together, after fees your venue paid and refunds, with each one’s breakdown a click away.
Last 30 days, this month, all time or dates you pick, kept as you move between reports.
Every event with its tickets sold, tables booked and total, to search and sort.
Two nights side by side with the difference for each figure, and the door count when your door used the Clicker.
Fees guests paid on top never count as your sales, and refunds count on the day they were made.
Tickets and passes
Each event’s tickets sold against its capacity, its sales and how many were scanned in.
Ticket types and add-ons ranked, with types of the same name added up across events.
Each weekday by hour, and how far ahead half your guests buy.
At the door shows each event’s check-ins by the hour.
Passes sold, admissions, how many were used and the events passholders came to.
Tables
Each event’s tables booked and waiting, section by section, with its booking pace.
Bookings from requested to completed, and how many deposit requests were paid.
Your sections, or single tables, ranked.
Online, by staff or from a chat offer, or split by team member.
The door and your audience
Everyone through the door, the male and female split, your busiest nights and the busiest hour.
The door count against tickets and passes scanned, so you see how many came in without a scan.
Your tracking links and promo codes ranked, with Direct for sales without a link.
Page views and unique visitors each day, on your booking page and at checkout.
How many chats guests started, and how long they lasted on average.
For nights you want to read back.
- NightclubsTicket, table and door figures for the same night, and two Saturdays side by side.VenueStack for nightclubs
- Ticketed eventsSales pace, ticket types and when people buy, to time the next release.VenueStack for ticketed events
- Event venuesEvery event in one list with its tickets, tables and total, across any date range.VenueStack for event venues



On the one plan.
Event analytics comes with every other feature on one published price, with a free trial before you pay.
One plan. Everything included.
Every feature on every account, and you can cancel whenever you like.
- Event calendar widget
- Ticket sales
- Table management
- Deposits
- Add-ons
- Passes
- Email campaigns
- Reporting
- QR door check-in
- Guest profiles
- Branded public pages
- Team roles and permissions
Questions, answered.
More questionsEach event’s tickets sold against its capacity, its sales and how many were scanned in, with its sales pace and ticket types a click away. The report also ranks what sold and where buyers came from, and shows when people buy.
Yes. Tick two events in Event Performance and click Compare, or start from an event’s Stats on the calendar. Each figure shows side by side, with the difference between them.
Yes, when each one has its own tracking link. Where buyers came from ranks your tracking links and promo codes, and Direct covers sales without a link.
Yes. When your door counts with the Clicker, the door report shows people counted by the hour for each night, with the busiest hour marked. The ticket report shows each event’s check-ins by hour.
No. Reports cover the tickets, tables and passes sold through VenueStack. VenueStack doesn’t connect to a POS, so bar takings stay on your till.
Owners, and any role you give Full or View Access to Reports. Roles with No Access don’t see Reports in their menu.
It’s included in the one VenueStack plan, with every other feature, and there’s a 14-day free trial. The price is on our pricing page.
Keep reading.
The features next to event analytics, and the guides behind it.
Playbooks

Your next event starts here.
Sell tickets, book tables and check guests in from one place.