Comparing event performance month over month should tell a venue operator which nights earned more, where revenue slipped, and what to change next. A bigger sales total can reflect an extra Saturday, a holiday headliner, or payments collected for future events. These seven metrics help separate calendar effects from changes in tickets, tables, drinks, and staffing.
The ranking starts with event economics, then moves through revenue delivery, demand, and operating costs. It suits venues selling admission, tables, and beverages. A festival without table service can skip that measure and move ticket pacing higher. Use the order to focus the review, then investigate whichever result needs a decision.
Match the trading calendar before comparing results
A useful monthly comparison starts with matching event groups. Separate regular club nights, private hires, holiday specials, and other formats with different prices or costs.
Assign each event to its service date, including activity after midnight. Keep advance cash collected for future events separate from revenue earned by the events under review. Apply the same reporting cutoff after each month so refunds and late invoices receive comparable treatment.
Consider a hypothetical venue with four comparable Saturdays generating $100,000, followed by five generating $115,000. Monthly revenue rose 15%. Revenue per Saturday fell from $25,000 to $23,000, a decline of 8%.
Use an events calendar view to identify extra trading nights, closures, holidays, and changes in format. Then compare totals alongside results per comparable night.
For ratios, divide the combined numerator by the combined denominator. Averaging event percentages gives a small night the same influence as a large one.
If the mix changed sharply, report each format separately. A month dominated by premium shows needs its own explanation. Keep unmatched events visible in the monthly total, with their contribution identified separately.
1. Event contribution per comparable night
Event contribution ranks first because it tests whether additional sales left more money after direct event costs. Owners deciding which recurring nights to retain should start here.
Contribution per night = (net earned event revenue − direct event costs) ÷ comparable event nights.
Count admission, beverage sales, table charges, and other earned event income once. Exclude sales tax, gratuities, and refunded amounts. A deposit applied to a final bill is part of that payment, so adding it again overstates revenue.
Deduct direct costs consistently: stock consumed, event labor, talent, promoter payouts, and transaction costs. Allocate shared costs using the same rule each month.
A revenue increase alongside lower contribution gives the review a clear direction. Check whether talent costs rose, discounts widened, or staffing hours increased faster than attendance. The discussion of revenue report gaps helps frame why a sales total alone leaves questions unanswered.
The limitation is overhead. This measure does not establish full business profit unless rent, administration, and other shared expenses are also allocated.
Keep it first in the monthly review. When contribution falls, identify the revenue or cost line responsible before changing the event schedule. Keep the underlying event results available so one exceptional night cannot hide a weaker recurring format.
2. Table minimum attainment
Table minimum attainment comes second for venues where reservations carry a large share of the night’s expected spend. It checks how much of the agreed minimum guests fulfilled through eligible purchases.
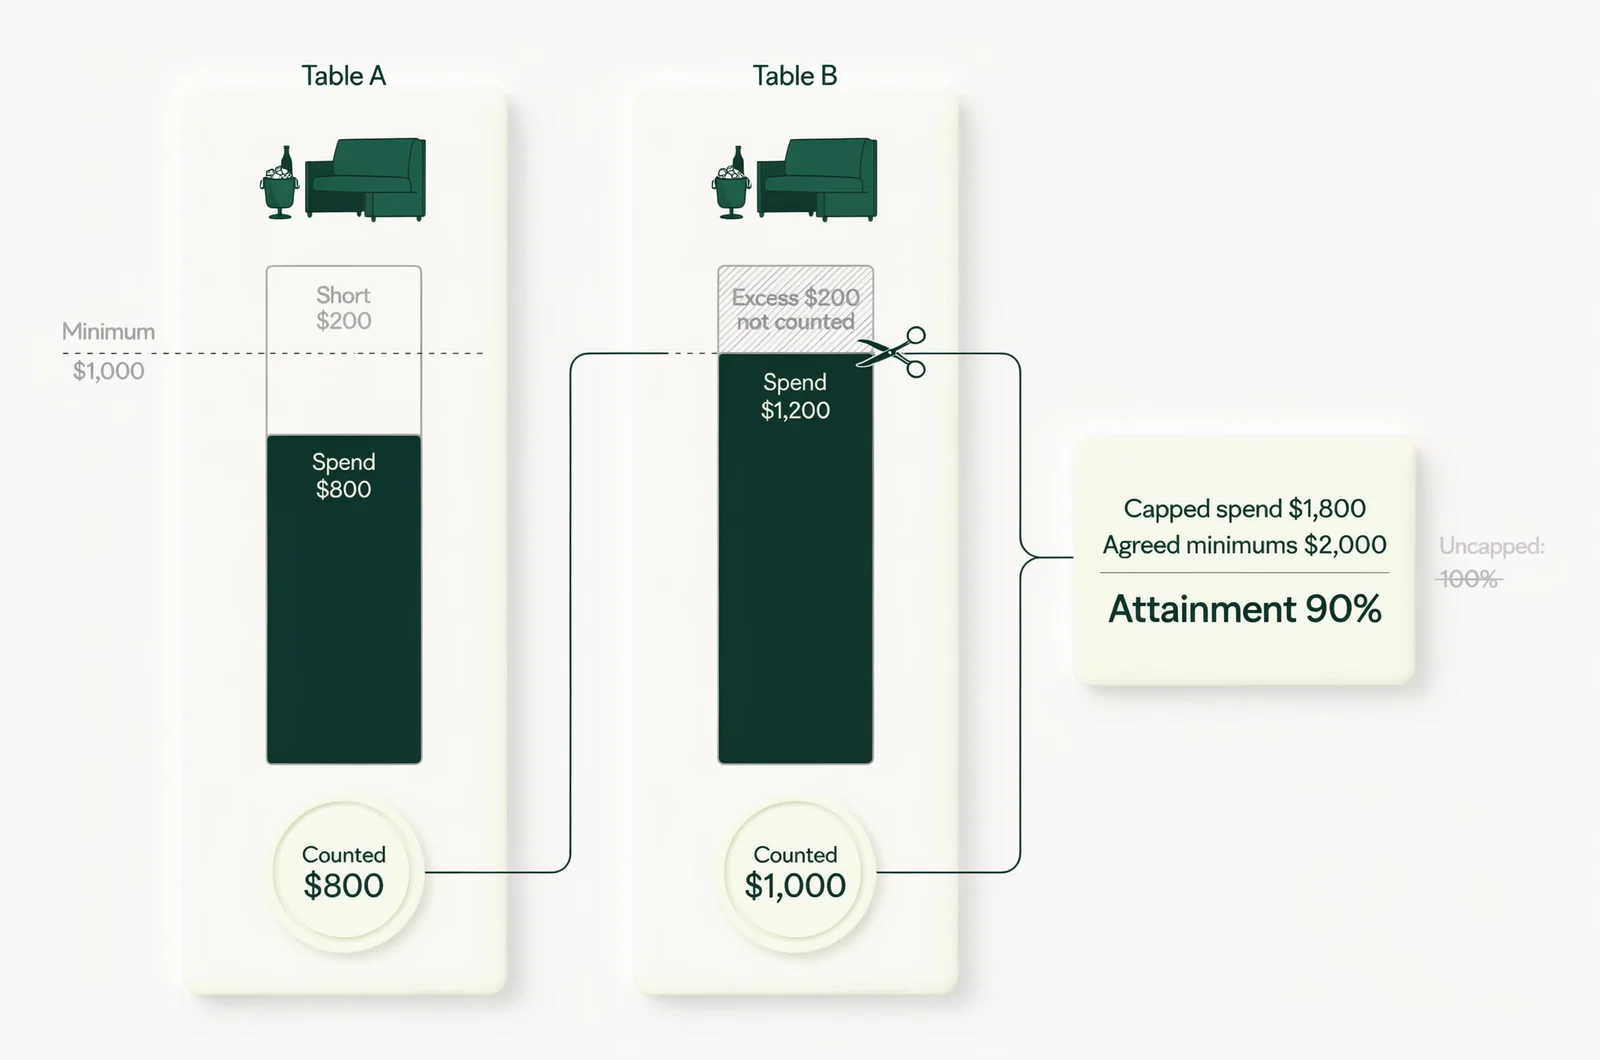
Use a capped version to prevent one large spender from hiding another table’s shortfall:
Minimum attainment = total eligible spend capped at each booking’s minimum ÷ total agreed minimums × 100.
For illustration, two bookings each have a $1,000 minimum. One spends $800 and the other spends $1,200. Capped attainment is 90%, although combined spend equals the combined minimum.
Build the denominator from confirmed bookings at a fixed cutoff. Retain bookings that later become no-shows. Use the same tax and charge basis as the minimum terms.
A table booking report can provide the booking records; reconcile actual eligible spend against the final checks. Keep retained no-show deposits separate from purchases, and count applied deposits only once within settled bills.
Reservations managers get the most value from this metric when checking booking quality and minimum enforcement. Its limitation is unused inventory: perfect attainment among booked tables says nothing about tables that remained empty.
Review attainment alongside the number of tables booked and the minimum value committed. Investigate shortfalls by booking before raising next month’s minimums.
3. Bar spend per checked-in guest
Bar spend per guest ranks third because it tests whether attendance translated into beverage revenue. It is especially useful when the room stayed busy but sales softened.
Bar spend per guest = net beverage revenue ÷ unique checked-in guests.
Include table beverage purchases if table guests are included in attendance. Deduplicate re-entry scans, include complimentary guests, and apply the same refund treatment each month. Keep admission revenue outside the numerator.
This is a room-wide measure. Average spend among guests who purchased drinks answers a different question and needs a different denominator.
Bar managers should separate changes in guest mix from changes in service. A month with more table guests, longer events, or different drink prices needs context before anyone credits staff performance.
The limitation is that the average cannot explain its own movement. Lower spend could reflect fewer purchases, lower prices, a different audience, or incomplete sales matching.
Break the result down by event format and, where the records support it, table and general-admission guests. Check transaction counts and comparable drink prices before changing the menu.
If attendance records are incomplete, label the result provisional. Correct the guest count before using the figure to set sales targets for the next month’s bar shifts.
4. Advance ticket pacing
Advance ticket pacing ranks fourth because it supports decisions before doors open. Promoters and event managers can use it to judge whether a comparable event is selling earlier or later.
Seven-day sell-through = valid paid tickets sold seven days before doors ÷ planned paid-ticket inventory × 100.
Compare the same checkpoints, such as 14, seven, and one day before the event. Use the same event formats and record how long tickets had been on sale.
For a hypothetical 500-ticket allocation, 150 tickets sold at seven days means 30% sell-through. Selling 200 at the same checkpoint means 40%. That is a ten-percentage-point improvement.
Keep inventory changes visible. Reducing the allocation can improve the percentage without selling another ticket. Store checkpoint snapshots so later refunds do not silently rewrite earlier pacing reports.
An average ticket sales timeline provides context for choosing checkpoints that suit the format.
The limitation is the finish. Faster early sales do not establish stronger final demand or better contribution, especially if discounts drove the increase.
Use pacing to decide when to review promotion, allocations, and staffing assumptions. Confirm the result against final sales and ticket yield after the event, and record any campaign change against the checkpoint that prompted it.
5. Paid ticket show rate
Paid ticket show rate ranks fifth because it connects advance sales to actual arrivals. Door managers and operators planning beverage stock need to distinguish tickets sold from guests present.
Paid ticket show rate = unique checked-in advance-ticket holders ÷ valid advance tickets × 100.
Exclude refunded and canceled tickets. Count admission tickets, not purchasing accounts or orders. Keep complimentary admissions and tickets purchased at the door separate from this calculation.
Compare the same event groups and admission rules. An advance-ticket package with a strict arrival deadline needs separate treatment from a ticket valid throughout the night.
This measure helps interpret a month where presales held steady but beverage revenue declined. Fewer ticket holders arriving would reduce the number of guests available to purchase drinks.
Its limitation is scan quality. Missing scans can look like no-shows. Reconcile manual admissions, scanning exceptions, and re-entry records before treating a decline as a guest behavior problem.
Do not infer the cause from the percentage alone. Transport problems, changed plans, ticket terms, and recording gaps require different responses.
Use a verified decline to revise arrival forecasts. Keep the original ticket count and actual arrivals beside the rate so staff can see the size of the gap.
6. Net ticket yield
Net ticket yield ranks sixth because it explains how much admission revenue each paid ticket produced. It suits operators reviewing discounts, price tiers, and the balance between presales and door sales.
Net ticket yield = net venue-retained admission revenue ÷ valid paid admission tickets.
Include advance and door tickets on a consistent basis. Remove canceled tickets and refunded revenue. A partial refund reduces revenue while the still-valid ticket remains in the count.
Exclude sales tax and apply a fixed rule for buyer fees. If admission is bundled with a table package, use a documented allocation so the same money does not appear in both categories.
Review the presale and cover revenue mix when yield changes. A larger share of lower-priced advance tickets can move the average even when every price tier stays unchanged.
The limitation is timing and volume. Higher yield may accompany fewer sales, while a lower yield may accompany more paid attendance. Neither result establishes the effect on contribution.
Break yield down by ticket tier, sales channel, and comparable event format. Start with the largest revenue change.
Use the result to revise a specific allocation or price tier, then assess total contribution after the next comparable event.
7. Direct labor cost per attendee
Direct labor cost per attendee ranks seventh because it checks whether staffing cost moved in line with the room’s actual workload. It is useful for general managers reviewing recurring schedules.
Labor cost per attendee = direct event labor cost ÷ unique checked-in attendees.
Define included roles once. Door, bar, floor, cleanup, and event management can all belong in the measure. Include setup and closing hours, with consistent treatment of agency charges and employer costs.
Record the cost basis beside the result. A wages-only figure cannot be compared directly with one that includes employer charges and agency fees.
When the ratio rises, separate attendance, hours, and pay rates. Lower turnout can increase cost per guest even if the staffing schedule stayed unchanged. More overtime can produce a different problem with the same headline result.
The limitation is service quality. A lower ratio says nothing about queue length, workload, or the coverage needed to operate the event properly.
Compare like formats and operating hours. Use service records and arrival patterns to identify where staffing hours were needed.
Keep minimum operating coverage visible. Adjust the shift or role behind the variance, then check the following comparable event for cost, queues, and closing workload.
Turn the seven metrics into one monthly operating decision
The monthly review should connect each changed metric to an action someone can own. Keep the previous result, current result, denominator, likely explanation, and responsible manager together.
Calculate monthly ratios from combined values. For example, divide all eligible beverage revenue by all matched attendees, rather than averaging each event’s spend per head.
Then read the relationships. Rising attendance with lower contribution warrants a review of yield, discounts, and direct costs. Stable ticket sales with fewer arrivals warrants a scan check and show-rate review.
Give each investigation a clear question. “Did the additional discount allocation produce enough contribution?” is easier to assess than “Why was the month weak?”
A useful comparison calculator could accept event-level records, group matching formats, and display raw totals beside normalized changes. It should flag missing inputs and zero denominators.
The reporting system also needs records that reconcile across tickets, tables, check-in, beverage sales, and costs. Keep unresolved differences visible.
Choose one operating change per identified cause, record its owner, and set a review date after the next comparable event.
When the monthly numbers need a second look
Monthly changes need careful wording when percentages, missing data, or small baselines could distort the result.
How do you calculate the monthly percentage change?
Subtract the previous value from the current value, divide by the previous value, and multiply by 100. For rates, also report the percentage-point difference. A move from 80% to 85% is five percentage points, or 6.25% relative growth. Keep those descriptions distinct.
What if the previous month was zero?
Report the absolute change and mark percentage growth unavailable. Dividing by zero does not produce a useful growth rate. For a new event format, establish a baseline from completed events before judging a trend. Show the number of events behind that baseline.
What if beverage sales cannot be matched to events?
Leave event-level bar spend unreported until the sales period and attendance records align. Venue-wide monthly beverage revenue divided by selected event attendance creates a mismatched ratio. Keep the monthly sales total available, explain the missing match, and assign someone to reconcile the records.